Why outdated numbers hurt you
Our industry moves fast. The hardware we build on evolves constantly, which means even recent textbooks can become outdated quickly. A book from a few years ago might still teach sound patterns while quoting numbers that are off by orders of magnitude.
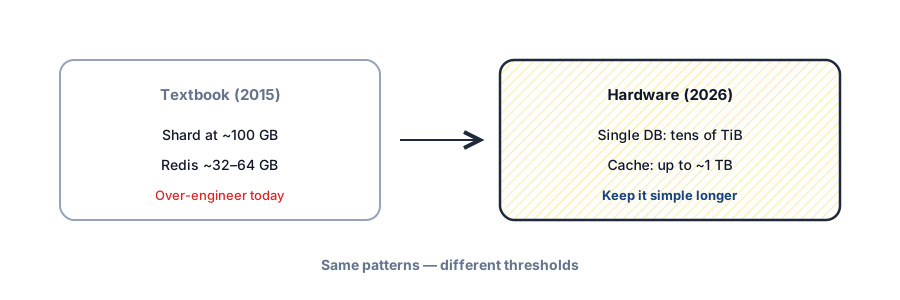
One of the biggest giveaways that a candidate has book knowledge but little hands-on feel is when they run scale math with 2015 (or even 2020) constraints. You’ll hear worries about database sizes, memory limits, and storage costs that made sense then — and that would push you to over-engineer today.
RAM, SSD, network in 2026.
Cache, DB, apps, queues.
Metrics + scale triggers.
Premature shard / over-queue.
Modern hardware limits
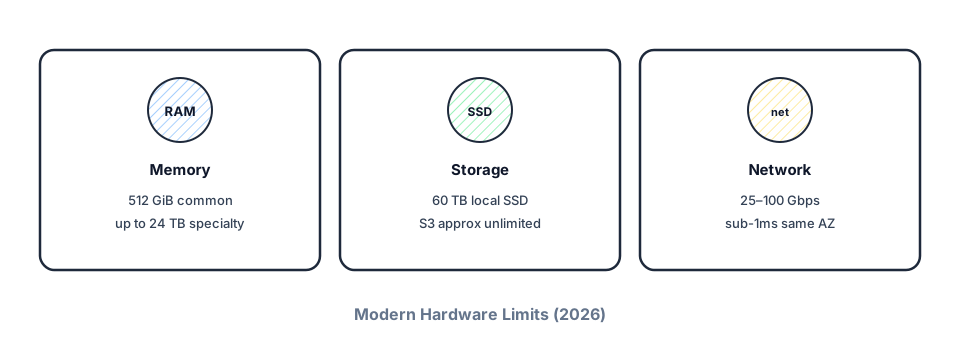
Modern servers pack serious compute. An AWS M6i.32xlarge comes with 512 GiB of memory and 128 vCPUs for general workloads. Memory-optimized instances go further: X1e.32xlarge provides 4 TB of RAM; U-24tb1.metal reaches 24 TB. That shift matters — many apps that once required distributed systems can now run on a single machine.
Storage grew similarly. Instances like i3en.24xlarge provide ~60 TB of local SSD; D3en.12xlarge offers hundreds of TB of HDD for data-heavy workloads. Object storage like S3 is effectively unlimited for interview purposes. Storage as a primary constraint is largely behind us.
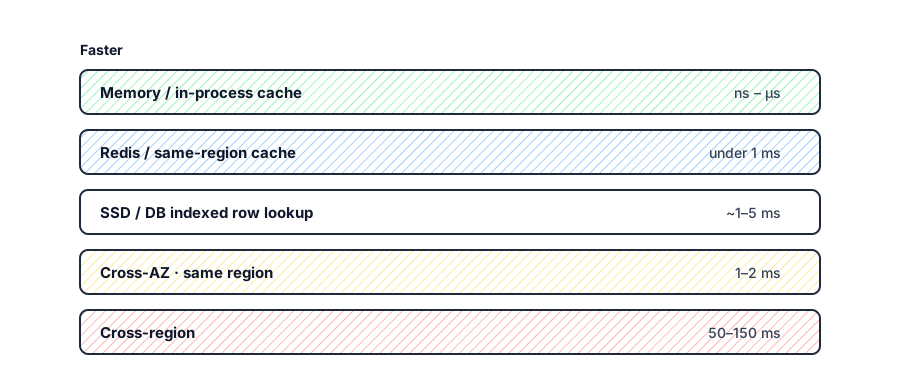
Networks kept pace: 25 Gbps is common in-datacenter; high-performance instances support 50–100 Gbps+. Latency is predictable — sub-1 ms within an AZ, 1–2 ms across AZs in a region, 50–150 ms cross-region.
Caching
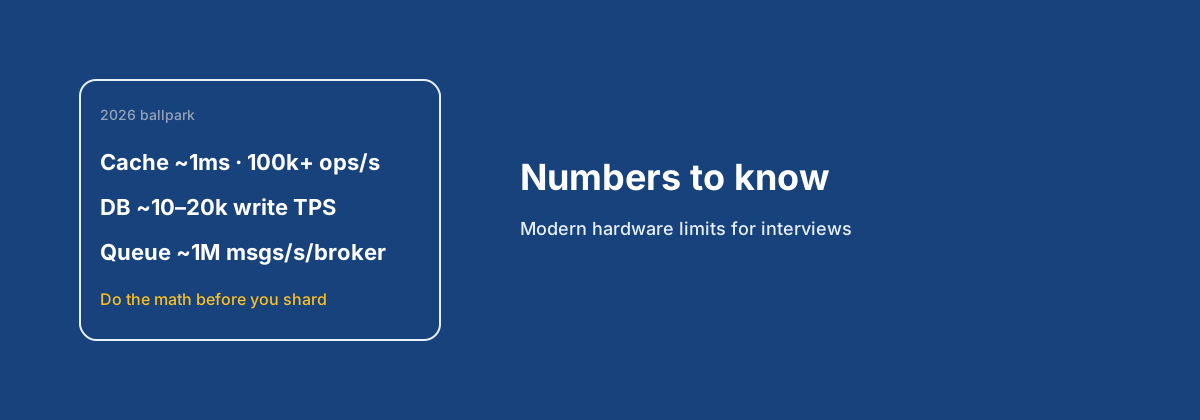
In-memory caches have grown in both size and capability. The era of 32–64 GB Redis nodes that forced careful partial caching is over. Today’s caches routinely hold terabyte-scale datasets with single-digit millisecond latency, and a single instance can process hundreds of thousands of operations per second.
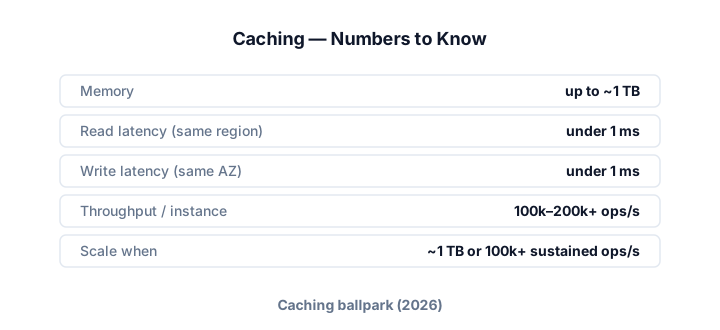
- Memory — up to ~1 TB on memory-optimized instances (some configs exceed this).
- Latency — reads under 1 ms same-region; writes under 1 ms same-AZ, ~1–2 ms cross-AZ for optimized setups.
- Throughput — 100k–200k+ ops/sec per instance on modern ElastiCache Redis / Graviton-class nodes.
- Scale when — dataset near ~1 TB, sustained 100k+ ops/sec, or sub-0.5 ms latency requirements.
You can often cache entire databases of hundreds of GB and skip complex partial-caching schemes. When you do scale, the bottleneck is usually ops/sec or network — not memory size. See caching strategies.
Databases
Single PostgreSQL or MySQL instances now routinely handle dozens of terabytes while staying in the millisecond range for simple work. Modern primaries efficiently handle tens of thousands of transactions per second — the bottleneck is often operational (backups, ops complexity) rather than raw performance.
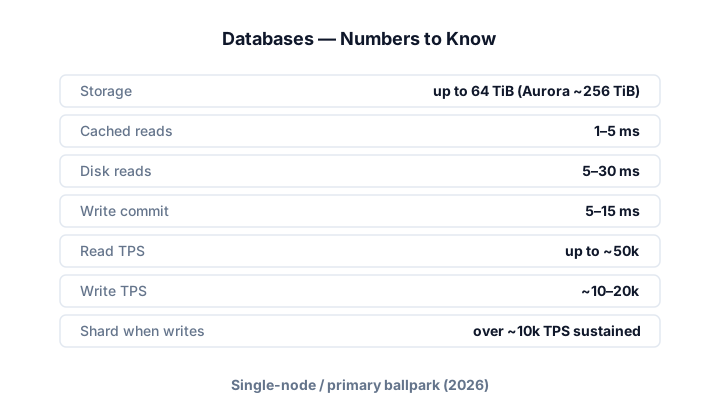
- Storage — up to ~64 TiB for most engines; Aurora up to ~256 TiB.
- Latency — 1–5 ms cached reads; 5–30 ms disk; ~5–15 ms write commit on tuned single-node setups.
- Throughput — up to ~50k read TPS; ~10–20k write TPS on Aurora/RDS-class single-node configs.
- Connections — roughly 5–20k concurrent, depending on engine and instance.
When to consider sharding
- Dataset approaching or exceeding ~50 TiB
- Write throughput consistently over ~10k TPS
- Uncached read latency requirements under ~5 ms that tuning can’t meet
- Geographic distribution needs
- Backup/recovery windows that become operationally impractical
Candidates reach for sharding too fast — 500 GB or a couple of terabytes and they’re already picking a shard key. Slow down, do the math, and confirm you need it.
Application servers
Modern app servers handle thousands of concurrent connections with modest resources; cloud platforms scale out quickly under load. CPU — not memory or connection limits — is usually the first bottleneck.
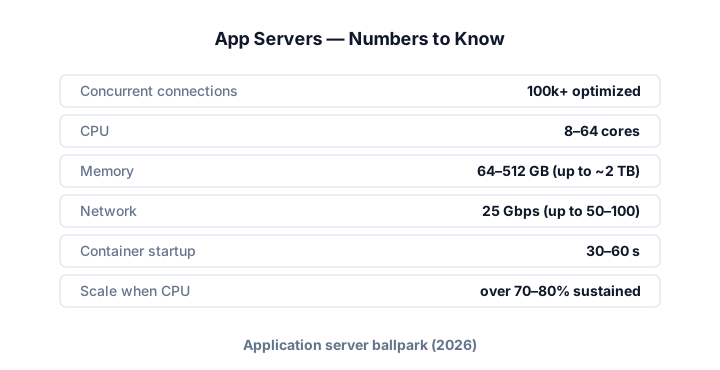
- Connections — 100k+ concurrent per instance when optimized.
- CPU / memory — 8–64 cores; 64–512 GB standard, up to ~2 TB high-memory.
- Network — 25 Gbps standard; 50–100 Gbps on high-performance instances.
- Startup — ~30–60 seconds for containerized apps.
- Scale when — CPU or memory sustained over ~70–80%, latency over SLA, or network near instance limits.
Stateless services still help you scale, but don’t forget local memory: process caches, in-memory compute, and sessions can buy a lot before you reach for another service. Aggressive auto-scaling is often better than chronic over-provisioning.
Message queues
Queues are no longer just “async task dumpers.” Modern systems like Kafka process millions of messages per second with single-digit millisecond latency while retaining weeks or months of data.
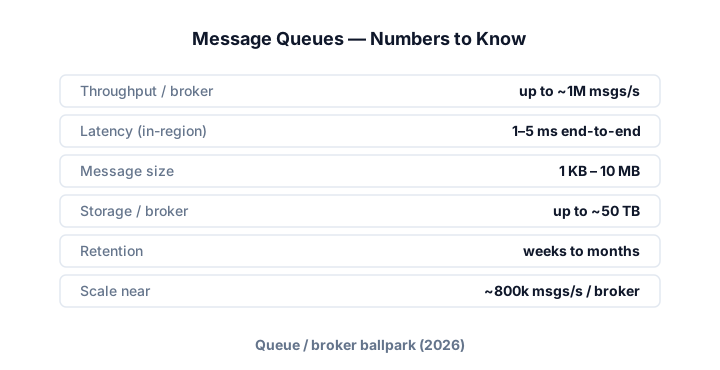
- Throughput — up to ~1M messages/sec per broker in modern configs.
- Latency — ~1–5 ms end-to-end in-region when tuned.
- Size / storage — 1 KB–10 MB messages efficiently; up to ~50 TB per broker; weeks–months retention.
- Scale when — nearing ~800k msgs/sec per broker, very high partition counts, growing consumer lag, or cross-region replication needs.
Sub-5 ms latency means queues can sit inside synchronous request paths — reliable delivery and decoupling without forcing every API to be async — as long as there is no backlog. More in message queues.
Cheat sheet
One-stop ballparks for 2026. These are typical values for well-tuned systems — your workload will vary. Use them to start capacity conversations, not as hard limits. Cloud offerings change; treat this as a living baseline.
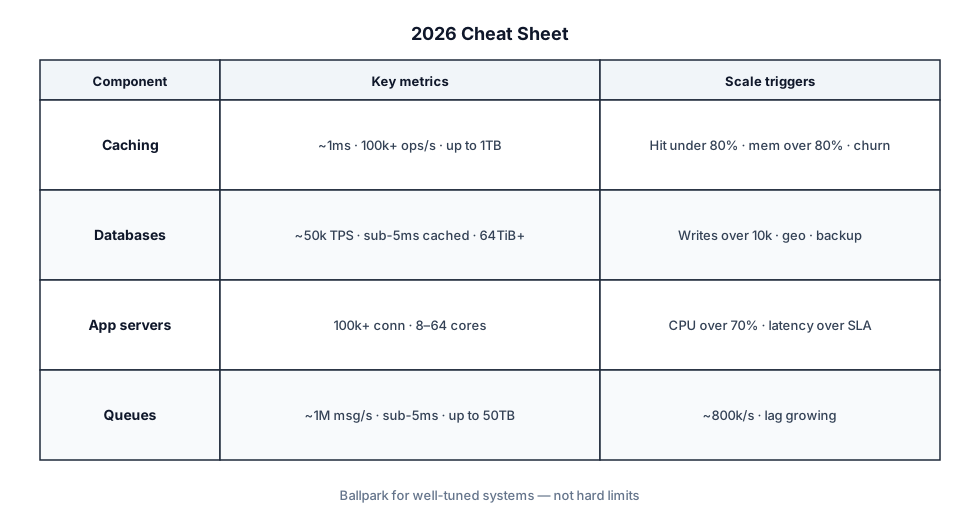
Component       Key metrics                         Scale triggers
─────────────── ─────────────────────────────────── ─────────────────────────────
Caching         ~1ms · 100k+ ops/s · ≤1TB mem       Hit <80% · mem >80% · churn
Databases       ~50k TPS · <5ms cached · 64TiB+     Writes >10k · geo · backup
App servers     100k+ conn · 8–64 cores · 64–512GB  CPU >70% · latency > SLA
Message queues ~1M msgs/s · <5ms · ≤50TB/broker ~800k/s · lag growingCommon mistakes in interviews
Premature sharding
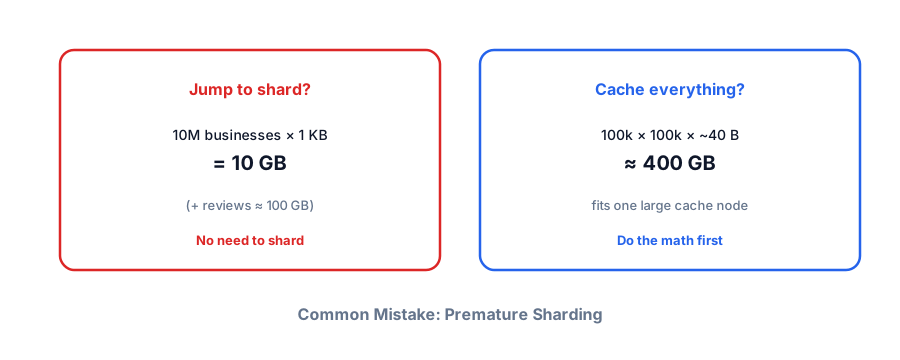
The biggest mistake: assuming sharding is always necessary. Candidates introduce a data model and immediately pick a shard key — especially on Design Yelp.
10M businesses × ~1 KB ≈ 10 GB. Even 10× for reviews lands around 100 GB. Why would you shard?
Same with caches. A leaderboard with 100k competitions × 100k users × ~(36B id + 4B float) ≈ 400 GB — still one large cache node, no shard required.
Overestimating latency
Candidates often vastly overestimate SSD / simple indexed row lookup latency. We’re talking sub-millisecond to a few milliseconds. Don’t add a cache layer just to “make a simple PK lookup faster” — cache expensive queries, not every read.
Over-engineering “high” write throughput
5k writes/sec sounds scary until you remember a tuned Postgres with simple writes can handle 20k+ WPS. What actually hurts write capacity: multi-table transactions, write amplification from too many indexes, cascading updates, or heavy concurrent reads.
Queues earn their keep for guaranteed delivery, event sourcing, spikes above what the DB can absorb (~20k+ WPS for a single Postgres), or decoupling producers from consumers — not for every “busy” write path. Try batching, better indexes, pooling, or async commits first.
Fermi estimation drills
| Order of magnitude | Remember |
|---|---|
| L1/L2 cache | ~1–10 ns |
| Main memory | ~100 ns |
| SSD random | ~100 µs |
| Same-AZ network | ~0.5 ms |
| Cross-region | ~50–150 ms |
| HDD seek | ~10 ms |
Back-of-envelope template
QPS_avg = DAU * actions_per_day / 86400\nQPS_peak = QPS_avg * peak_factor (5–10)\nStorage = objects * size * replicas * years\nBandwidth = QPS * payload_size
Say assumptions out loud so the interviewer can correct them.
Failure modes to mention
Call out at least one dependency failure (DB down, cache stampede, queue lag, region outage) and your mitigation (timeouts, retries with jitter, degraded mode, circuit breaker).
Cost and performance levers
Interview Q&A by level
Practice saying these out loud for back-of-envelope numbers. Interviewers grade clarity and judgment more than buzzwords.
Match depth to the bar: define → trade off → operate. Don't dump principal answers in an entry-level screen.
Wrapping up
Modern hardware changed the calculus. Distributed systems remain necessary for the world’s largest apps — but many designs can stay simpler than traditional wisdom suggests.
- Single databases can hold terabytes.
- Caches can hold entire datasets in memory.
- Queues can be fast enough for synchronous flows (with no backlog).
- App servers have enough RAM for meaningful local optimization.
The insight isn’t “always scale vertically” — it’s knowing where the real limits are so you don’t optimize prematurely. That balance of theory and practical thresholds is especially visible at senior levels.
Pair with scalability, sharding, caching, and message queues.